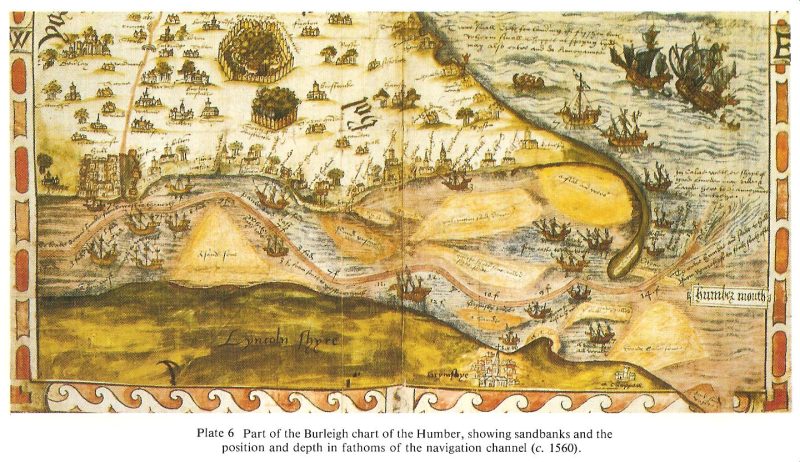
Even by the 1560s (s.p.b.) there would have been far more ships sailing up and down the Humber Estuary and along the East Yorkshire coast than might be seen today, but, of course, much smaller in size. Burleigh’s map shows this by the many ships shown on his map (s.p.b.), most of them three-masted rather than just the single masts of the keels and sloops of later times. The coastal coal-trade, for example, was to remain important until the early 19th century with the development of a national rail network and the opening-up of coalmines in West Yorkshire and Nottinghamshire. Other bulk cargos were also moved by boat/ship far more readily than by road until the coming of the railways. Indeed, alongwith Elizabeth I’s resolve to extend her father’s Navy, the purpose of early national maps such as Burleigh’s was as much navigational as terrestrial. Churches apart, the above section of Burleigh’s map shows more detail in the Humber Estuary than on the land of Holderness to the north. Settlements and private parks are shown but representations of the topography are minimal.
A question that might be asked is how did the cartographers in Burleigh’s employ know about the extent and size of the siltbanks/mudbanks in the lower Estuary? Today the equivalent areas hardly break the surface even at low tide. Of course the Cherry Cobb Sands and Sunk Island areas are now ‘dry land’, no longer mudbanks as shown on Burleigh’s map.It may be that they used a plumb-line to get lots of readings in a given area but this would have had to be done at low-tide or soon before and after. Of course, it may be that, for whatever reason, in the mid 16th century the mud-banks were visible, at least on an ebb tide.
By the mid 16th century the deep-water route to Hull was critical, Hedon had never achieved the staus envisaged in the 13th century, the trade of Barton and South Ferriby had declined, Ravenser Odd was no more and Immingham and Goole were as yet agricultual hamlets.